

Infographics are powerful tools for visually communicating complex information. Adobe Illustrator provides the perfect platform for creating clean, professional, and engaging infographics. This step-by-step guide will help you design impactful infographics from concept to completion.
1. Define the Purpose and Audience
Identify the main goal of the infographic and its target audience.
Questions to Consider:
- What message do I want to convey?
- Who is the intended audience?
- What style suits the topic?
2. Collect and Organize Data
Gather accurate and relevant data for the infographic.
Tips:
- Use credible sources for data.
- Group similar data points.
- Focus on key insights to avoid clutter.
3. Plan the Layout
Sketch the structure of the infographic.
Layout Ideas:
- Vertical or horizontal flow
- Grid-based design
- Sections for text, icons, and visuals
4. Set Up the Canvas
Create a workspace for the infographic.
Settings:
- Size: 800×2000 px (vertical format)
- Color Mode: RGB for digital, CMYK for print
- Enable Guides for alignment
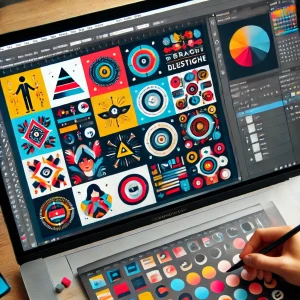
5. Choose a Color Scheme
Select a color palette that matches the topic.
Tips:
- Use Adobe Color for palette ideas.
- Limit to 3–5 colors for clarity.
- Use contrasting colors for emphasis.
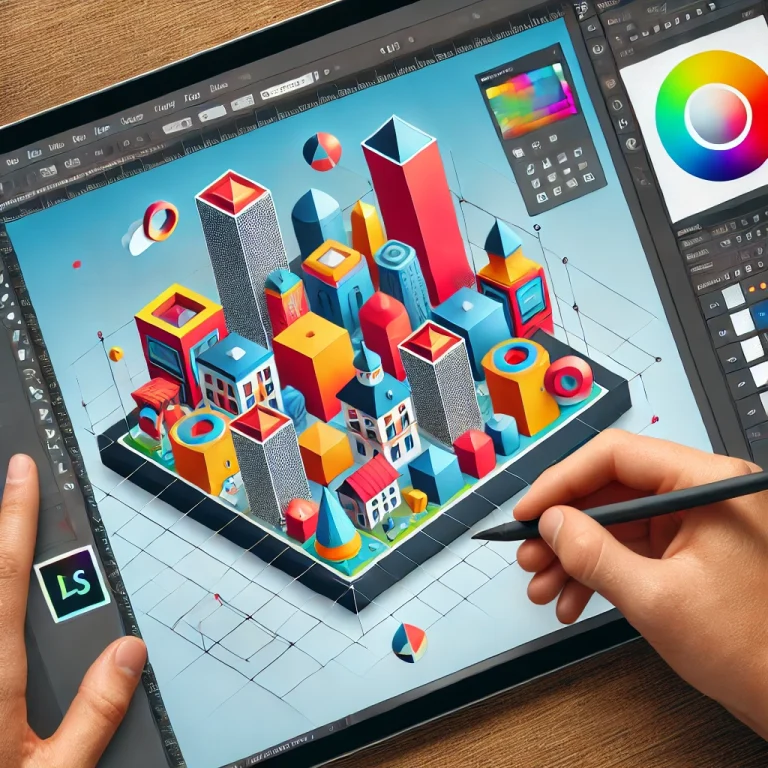
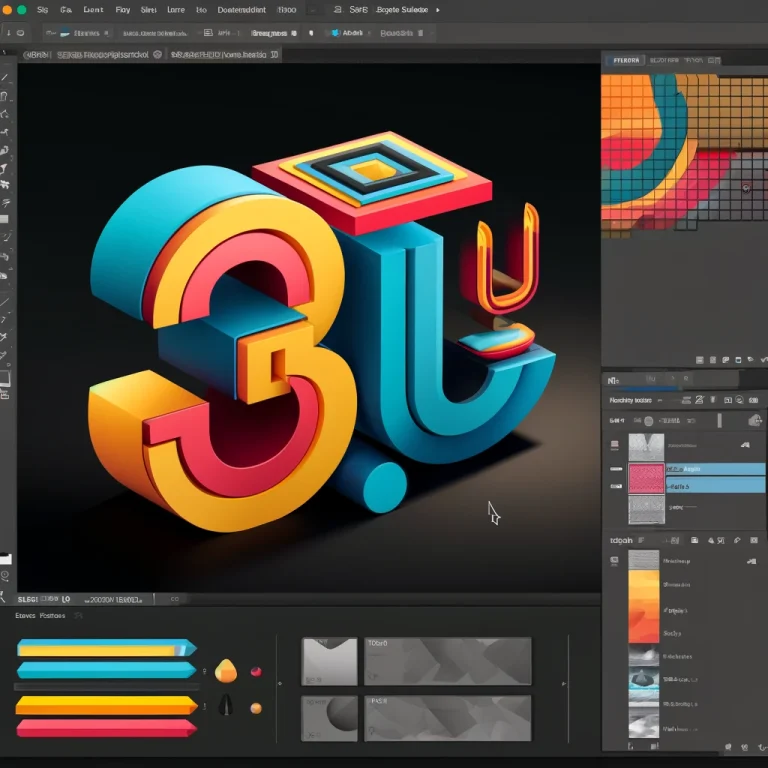
6. Use Icons and Graphics
Simplify data with visuals.
How to Apply:
- Create custom icons using Shape Tools and Pen Tool (P).
- Use the Symbol Panel for reusable elements.
- Incorporate illustrations to explain concepts.
7. Incorporate Charts and Graphs
Visualize data effectively.
Tools:
- Pie Graph Tool for percentages
- Line Graph Tool for trends
- Customize charts using colors and labels
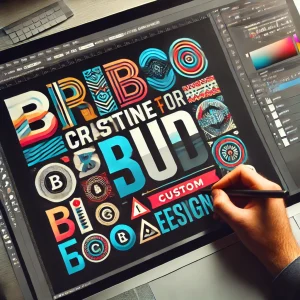
8. Balance Text and Visuals
Ensure information is easy to read and engaging.
Tips:
- Use clear and legible fonts.
- Keep text concise.
- Align visuals with related text.
9. Add Flow and Hierarchy
Guide the viewer’s eye through the content.
Techniques:
- Use arrows, lines, and shapes for direction.
- Vary font sizes for emphasis.
- Apply consistent spacing for organization.
10. Export the Infographic
Save the infographic for sharing and distribution.
Export Options:
- PNG or JPEG for online sharing
- PDF for high-quality prints
- SVG for scalable web graphics
Conclusion
Designing infographics in Adobe Illustrator allows you to turn complex data into visually appealing and informative graphics. By combining text, visuals, and data visualization, you can effectively communicate your message in a memorable way.


+ There are no comments
Add yours